
 InfoSearched
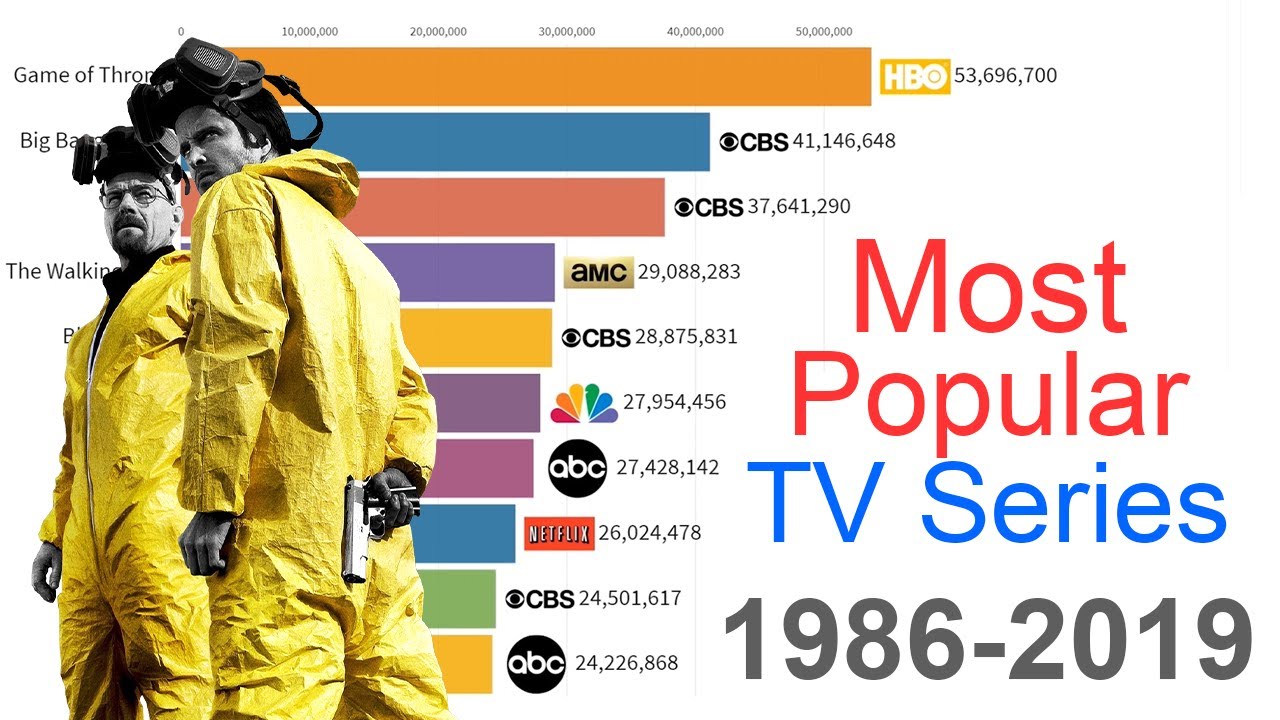
One chart just replayed 33 years of TV in under three minutes.
A bar-chart race titled “Most Popular TV Series 1986 – 2019” has been making the rounds online, and it’s the rare data visualization that actually tells a story. Built by the YouTube channel Data Is Beautiful — run by an anonymous Ph.D. student who treats chart-making as a hobby — the animation ranks television’s biggest shows year by year, watching broadcast giants get swallowed by streaming and torrent traffic in real time. It’s less a nostalgia trip than a receipt for how completely the business changed.
- The rankings blend three data sets: prime-time first-24-hour broadcast audience reports, one week of reported peer-to-peer (pirated) download statistics, and one week of streaming service viewership.
- The creator states the numbers are worldwide but carry a heavy U.S. bias through 2002, after which global p2p distribution and international streaming even things out.
- In 1986, The Cosby Show topped the chart pulling upwards of 60 million weekly viewers, running alongside Dallas as the era’s broadcast heavyweights.
Metric Construction Methodology
The methodology matters as much as the results here. Rather than leaning solely on Nielsen-style overnight ratings, the creator stacked three different measuring sticks on top of each other across the 33-year span, which is why a show’s bar can surge well after its network run ends. A series still getting torrented heavily in its off-season, for instance, can outrank something airing fresh episodes that same week.
That bias disclosure up front is the honest part. Anything before 2002 skews toward what American households were watching on CBS, NBC, ABC and Fox, simply because that’s where the measurable data existed. Once broadband-era piracy and international streaming numbers become trackable, the chart widens out to something closer to an actual global picture.
1986 Through the Network Era
The animation opens with broadcast sitcoms and prime-time soaps running the table. The Cosby Show‘s reported 60-million-plus weekly audience dwarfs anything a single series pulls today, and it shares the top of the board with Dallas, the primetime soap that had already turned “Who shot J.R.?” into a genuine national event a few years earlier. The original chart’s rundown of the period also names Cheers and A Different World among the decade’s other heavy hitters.
The Cosby Show captured upwards of 60 million weekly viewers at its peak — a number no single series, broadcast or streaming, comes close to touching by the chart’s final years.
Anyone curious about what was happening behind the scenes of that dominant Cosby Show run can find more detail in the dark secrets the show’s cast tried to keep quiet while it was still the most-watched program in America.
The 1990s and 2000s Broadcast Hangover
Moving into the 90s, teen drama and workplace sitcoms take over the bars: Beverly Hills, 90210, Roseanne, Seinfeld and Friends all get their turn near the top. The 2000s belong to broadcast mainstays like ER and CSI, which hold their positions for years before the chart shows audience fragmentation setting in — more channels, more DVRs, more choices splitting what used to be a handful of shows sharing nearly the entire national audience.
Streaming and Torrents Rewrite the Board
By the late 2010s the whole shape of the race changes. Broadcast dominance gives way to global streaming originals and prestige cable drama, with HBO’s Game of Thrones the clearest example of a show whose real audience — factoring in international streaming and torrent downloads — dwarfed what any single domestic broadcast number could capture. Stranger Things, Orange Is the New Black and Mindhorn-style genre hits populate the same stretch, riding the same global distribution the earlier decades never had.
It’s a fitting bookend: a chart that started measuring one country’s living rooms ends up measuring the entire planet’s. For anyone chasing what to actually watch next in that streaming-first landscape, the roundup of new titles hitting Netflix is a decent snapshot of where that shift eventually landed.
Unresolved Chart Limitations
The video never claims to be a definitive ratings history, and it shouldn’t be treated as one — a week of torrent data isn’t the same instrument as a Nielsen overnight, and the creator says as much. What it does capture cleanly is direction: fewer people watching the same broadcast at the same hour, more people finding the same show whenever and wherever they want.
The last stretch of the chart lands right as Game of Thrones wraps its run, which is really the whole thesis in one data point — a single HBO drama, tracked through torrents and streams from dozens of countries, outperforming what used to take three broadcast networks and 60 million American households to produce.










10 Cookie Shaping Hacks to Impress All the Cookie Lovers!!
Steve-O Shocks Gordon Ramsay While Making A Southwestern Omelette
THE BEST UPCOMING MOVIES 2020 (New Trailers)
The Best Upcoming SCIENCE-FICTION Movies 2021 (Trailers)
Musicians You Wouldn’t Want To Meet In Real Life